The Value of Experience Maps
People don’t just use products and services—they move through them, interpret, and form lasting impressions. Experience Maps uncover and visualize points of friction to aid organizational buy-in and prioritization.
At Cloudberry we often use Experience Maps to uncover unmet needs and align cross-functional teams around a shared understanding of the user experience. They are a great tool to generate buy-in and prioritize efforts.
So what exactly is an experience map?
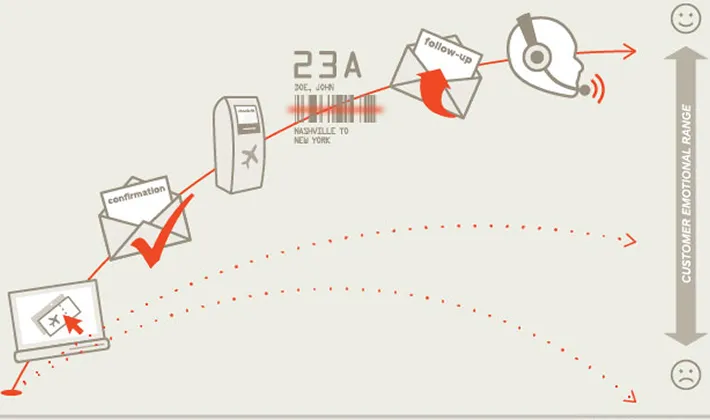
An Experience Map is a visual narrative of the end-to-end journey a person takes when interacting with a product, service, or brand. It captures the human side of interaction: what they do and how they think and feel along the way.
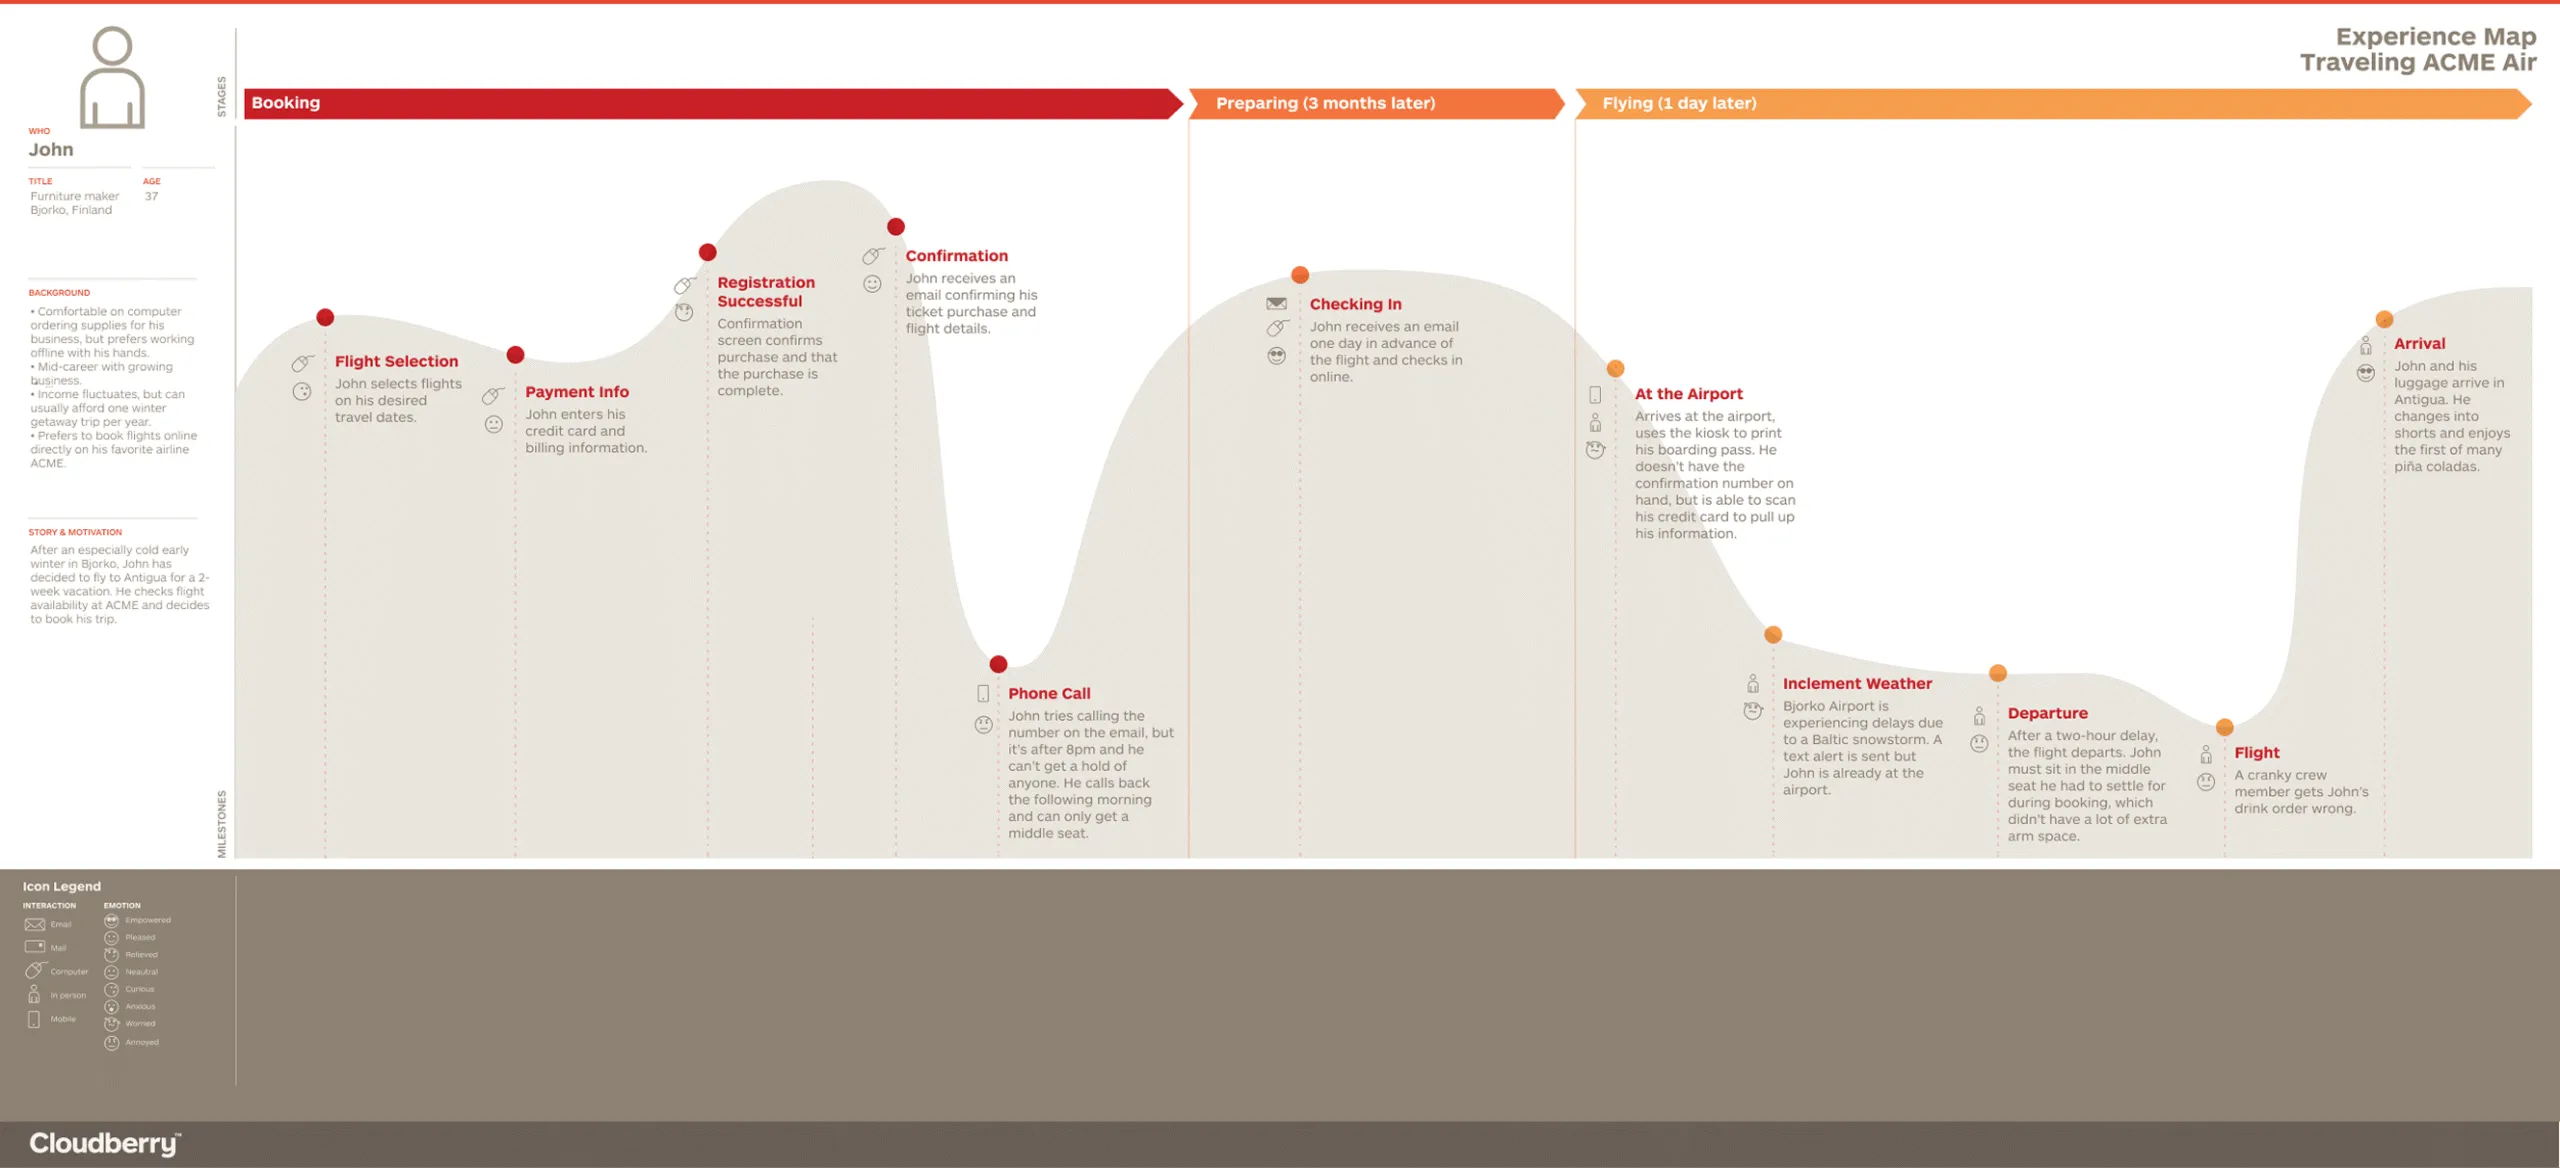
It’s a panoramic view that stretches beyond screens and interfaces to include moments before, during, and after engagement—helping teams grasp the full context in which decisions are made. For example, take a look at the experience map for “ACME Airlines.” The character “John” goes through the process of booking a tropical getaway from chilly Bjorko, Finland.
Think of it like this:
Experience Map
Map of the entire country (high-level overview of how people travel in general).
Journey Map
A detailed route from one city to another for a specific type of traveler.
Understanding the user
As John’s experience booking a flight shows, user experience is influenced by some factors than can’t be controlled (e.g. bad weather delaying a flight). This makes it paramount for us to identify which variables have the potential to cloud his overall experience, and which factors we can control.
John’s journey reveals psychological friction points:
- Search: Too many choices overwhelm him.
- Selection:“Most Popular” label anchors his decision.
- Checkout: Unclear fees, no trust signals causes anxiety.
- Confirmation: No post-purchase feedback leaves him cold.
These aren’t functional issues. They reveal that the system works, but it doesn’t feel good. These insights help our team shift from solving isolated usability issues to designing for behavioral flow.
From mapping to meaning
We break our approach down into two categories:
- The Technical Layer: What the System Does: The behind-the-scenes infrastructure and visible touchpoints (e.g., checkout flows, kiosks). Systems may function perfectly, but still feel broken to a user if they create confusion or friction. Each touchpoint becomes a marker on the experience map.
- The Qualitative Layer: How the User Feels: User thoughts, emotions, and behaviors. This layer reveals cognitive strain, trust gaps, delight triggers—what people feel and why. These feelings are paired with touchpoints on the experience map to demonstrate how interactions affect user perception.
At its core, an Experience Map bridges these two distinct worlds. It doesn’t just chart a journey, it reveals the story an organization is telling through every interaction, intentional or not. It brings to light the gaps between what the user needs and what they receive, challenging us to design with more clarity, empathy, and purpose. Experience Maps:
- Provide an end-to-end view of your system process. A user’s experience in a previous task will color their impression of the next one, and of the product as a whole.
- Show the multitude of channels by which users interact: Today, users can communicate through web, phone, email, text, and more. Your user may use all of these methods when using your service. How does this affect their experience?
- Reveal different states of the process: The linear storyline format of an experience map shows what your process looks like, what it could look like, and ultimately, what it will look like.
When do you use an Experience Map?
As UX professionals, our role isn’t just to build interfaces—it’s to orchestrate experiences that respect human behavior, reduce unnecessary friction, and create lasting value. Experience mapping is how we begin that process.
At Cloudberry, we often create Experience Maps when a project feels tangled—spanning multiple departments, channels, or decision-makers—or when personas alone aren’t revealing the whole picture. The map becomes a shared lens, aligning everyone around the user’s lived experience.. When necessary, it can be useful to add heuristic analysis, business overlays, user quotes & thoughts, or showstoppers to the map. The options are endless.
What processes do you have that might benefit from an Experience Map?